bmjhayward blog and writings
I write about science and technology, mostly. I live in Newcastle Australia and try to enjoy the good moments.
I had to keep the size of the matrices to 12x12, because some of the more complex types would cause to my laptop to hang indefinetely. I guess I could try on Amazon’s GPU cluster’s for fun sometime.
I used many of the matrices in scipy.linalg which made sense and weren’t too hard to get a norm using the approach in the code below. If you’ve never used the scipy library before, it’s a python library with a lot of scientific bells and whistles. See scipy.org if you’re interested.
Inverse hilbert is BY FAR the biggest!
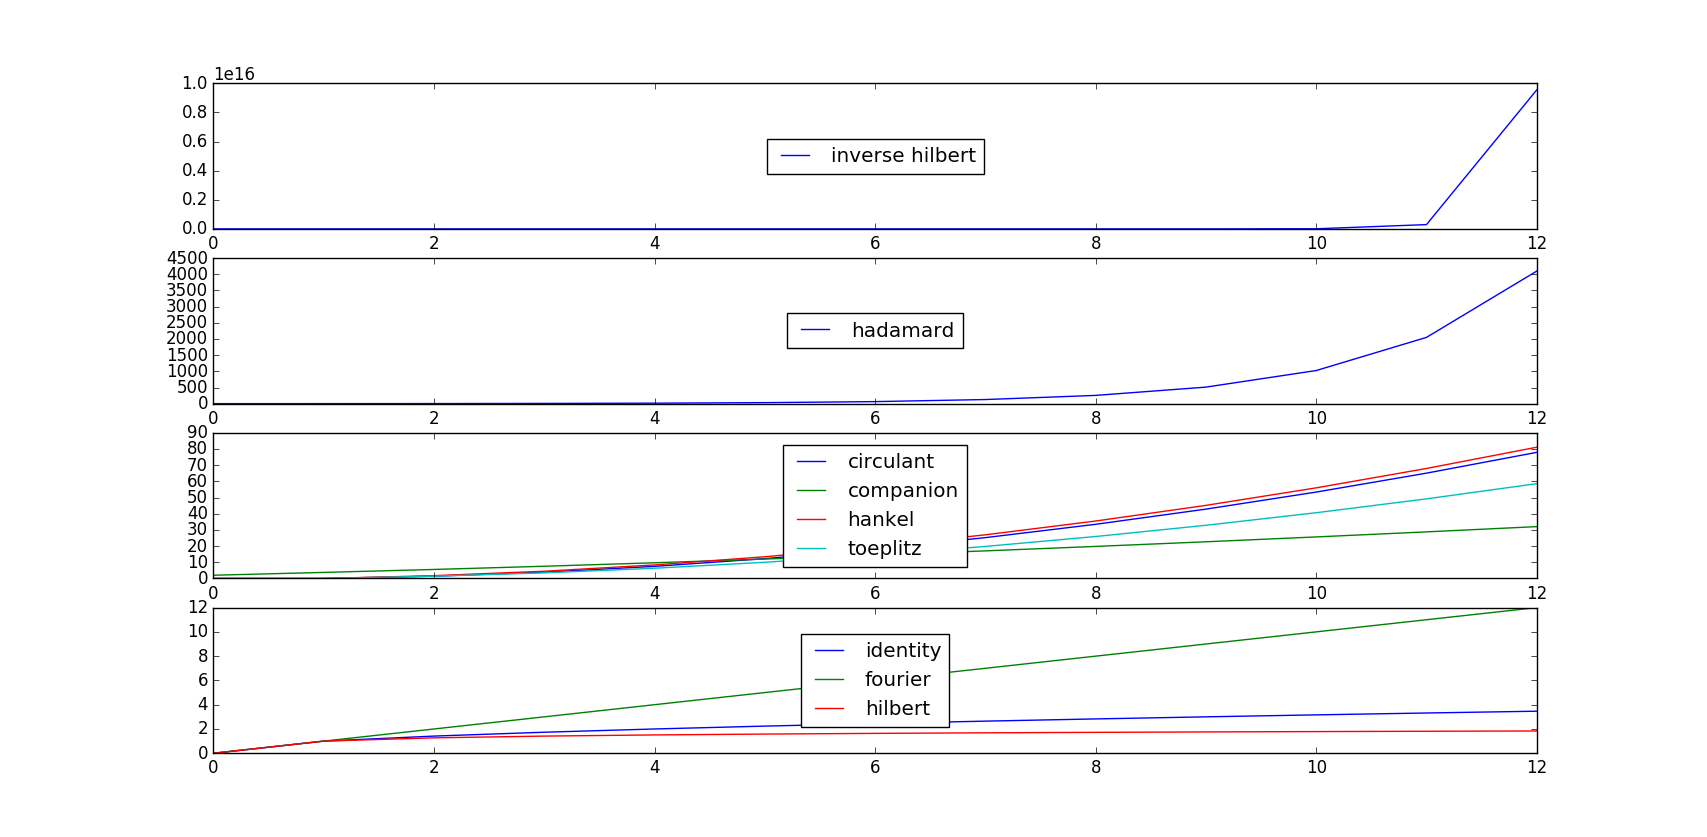 Figure 1: x-axes are n for nxn matrices, y-axes give the norm of the trace for each. Code for each is shown below.
I’ve tried to write the code in the most straight-forward way for me to think about. Perhaps later I’ll re-do this in a more elegant fashion.
import numpy as np
import scipy as sp
from numpy import linalg as npla
from scipy import linalg as spla
from matplotlib import pyplot as plt
identity_list = [
spla.norm(sp.eye(i), keepdims=True) for i in range(13)
]
circulant_list = [
spla.norm(
spla.circulant(range(i)), keepdims=True) for i in range(13)
]
companion_list = [
spla.norm(
spla.companion(
np.arange(1,i+3)), keepdims=True) for i in range(13)
]
fourier_list = [
spla.norm(spla.dft(i), keepdims=True) for i in range(13)
]
hilbert_list = [
spla.norm(spla.hilbert(i), keepdims=True) for i in range(13)
]
hadamard_list = [
spla.norm(
spla.hadamard(2**i), keepdims=True) for i in range(13)
]
hankel_list = [
spla.norm(
spla.hankel(
range(i), range(i)), keepdims=True) for i in range(13)
]
invhilbert_list = [
spla.norm(spla.invhilbert(i), keepdims=True) for i in range(13)
]
toeplitz_list = [
spla.norm(
spla.toeplitz(
range(i), range(i)), keepdims=True) for i in range(13)
]
fig = plt.figure()
subplt1 = fig.add_subplot(411)
subplt2 = fig.add_subplot(412)
subplt3 = fig.add_subplot(413)
subplt4 = fig.add_subplot(414)
subplt4.plot(identity_list, label=’identity’)
subplt3.plot(circulant_list, label=’circulant’)
subplt3.plot(companion_list, label=’companion’)
subplt4.plot(fourier_list, label=’fourier’)
subplt2.plot(hadamard_list, label=’hadamard’)
subplt3.plot(hankel_list, label=’hankel’)
subplt4.plot(hilbert_list, label=’hilbert’)
subplt1.plot(invhilbert_list, label=’inverse hilbert’)
subplt3.plot(toeplitz_list, label=’toeplitz’)
subplt1.legend(loc=’center’)
subplt2.legend(loc=’center’)
subplt3.legend(loc=’center’)
subplt4.legend(loc=’center’)
plt.show()