bmjhayward blog and writings
I write about science and technology, mostly. I live in Newcastle Australia and try to enjoy the good moments.
I did this in a jupyter notebook:
# %matplotlib inline
import numpy as np
import matplotlib.pyplot as plt
trace_norms = [np.sqrt(np.eye(i).trace()) for i in range(100)]
plt.plot(trace_norms)
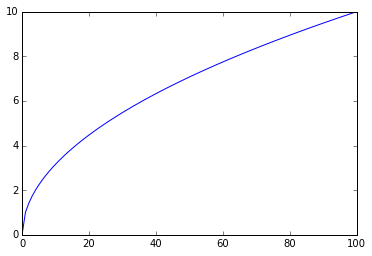 I get this logarithmic curve for all matrices so far
I got a similar curve for the below matrices:
- hadamard
- hankel
- pascal
- inverse pascal
- hilbert
- inverse hilbert
- fourier
- circulant
I may put together something more rigorous in future, as I am still curious as to why this happens.